Domain and Range
Domain: (-∞, ∞)
Range: (-∞, ∞)
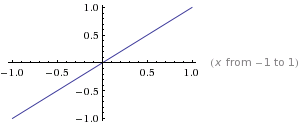
Graph
Table
|
X |
Y |
|
-2 |
-2 |
|
-1 |
-1 |
|
0 |
0 |
|
1 |
1 |
|
2 |
2 |
Description
In the function y = x, the input is the same as the output.
Characteristics
Concavity- The graph of y = x is neither concave up nor concave down due to the graph being linear.
Decreasing/Increasing- The graph of y = x is always increasing, so the interval where it is increasing is from (-∞, ∞).
Symmetry- The graph of y = x has odd symmetry because if rotated 180° around the origin, it is the same graph.
Maximum: none
Minimum: none
Limits-


