Domain and Range
Domain: (-∞, ∞)
Range: [-1, 1]
Graph
.gif)
|
X |
Y |
|
0 |
1 |
|
π/2 |
0 |
|
π |
-1 |
|
3π/2 |
0 |
|
2π |
1 |
Description
If there is a circle with a radius of one mapped on the coordinate plane, the input is the number of radians, which is a specific point along the circumference of the circle. The output is the x value associated with that specific point on the unit circle.
Characteristics
Concavity- The graph of y = cos(x) is concave down from [-π/2+2kπ,π/2+2kπ] concave up from [π/2+2kπ,3π/2+2kπ].
Decreasing/Increasing- The graph y = cos(x) is decreasing from [0+2kπ,π+2kπ], and increasing from [π+2kπ,2π+2kπ].
Symmetry- The graph of y = cos(x) has even symmetry because if reflected across the y-axis, it would be the same graph.
Maximum: 1 every 0+2kπ
Minimum: -1, every π+2kπ
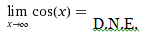
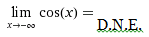
Limits-